
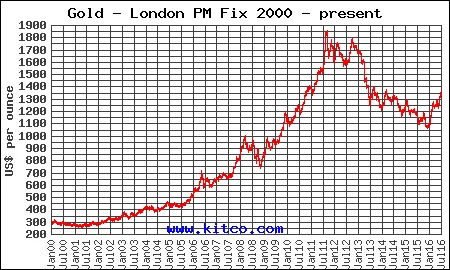
Gold has rallied strong so far in 2016. As I write, it is trading for about $1,322 per ounce, up about 26% from its late 2015, multi-year low of around $1,050. The question right now is, “Is the gold bear market over or is this just a counter-trend, bear market rally with lower prices still ahead?” Let us take a look at the key, fundamental supply and demand drivers.
Using data from the GFMS Gold Survey, I calculated that cumulative gold demand over the last 13 years (2003 - 2015) was roughly 48,000 tons. 62% of this demand came from jewelry, 13% from industry (mostly electronics), and 26% came from investment (central banks were net sellers of 1%). However, since the global financial crisis, the demand dynamics have shifted slightly. Since 2009, 51% of the 29,500 tons of gold demand went to jewelry, 10% went to industrial, and 39% went to investment (8% of this was central bank purchases). The following table shows this historical data:
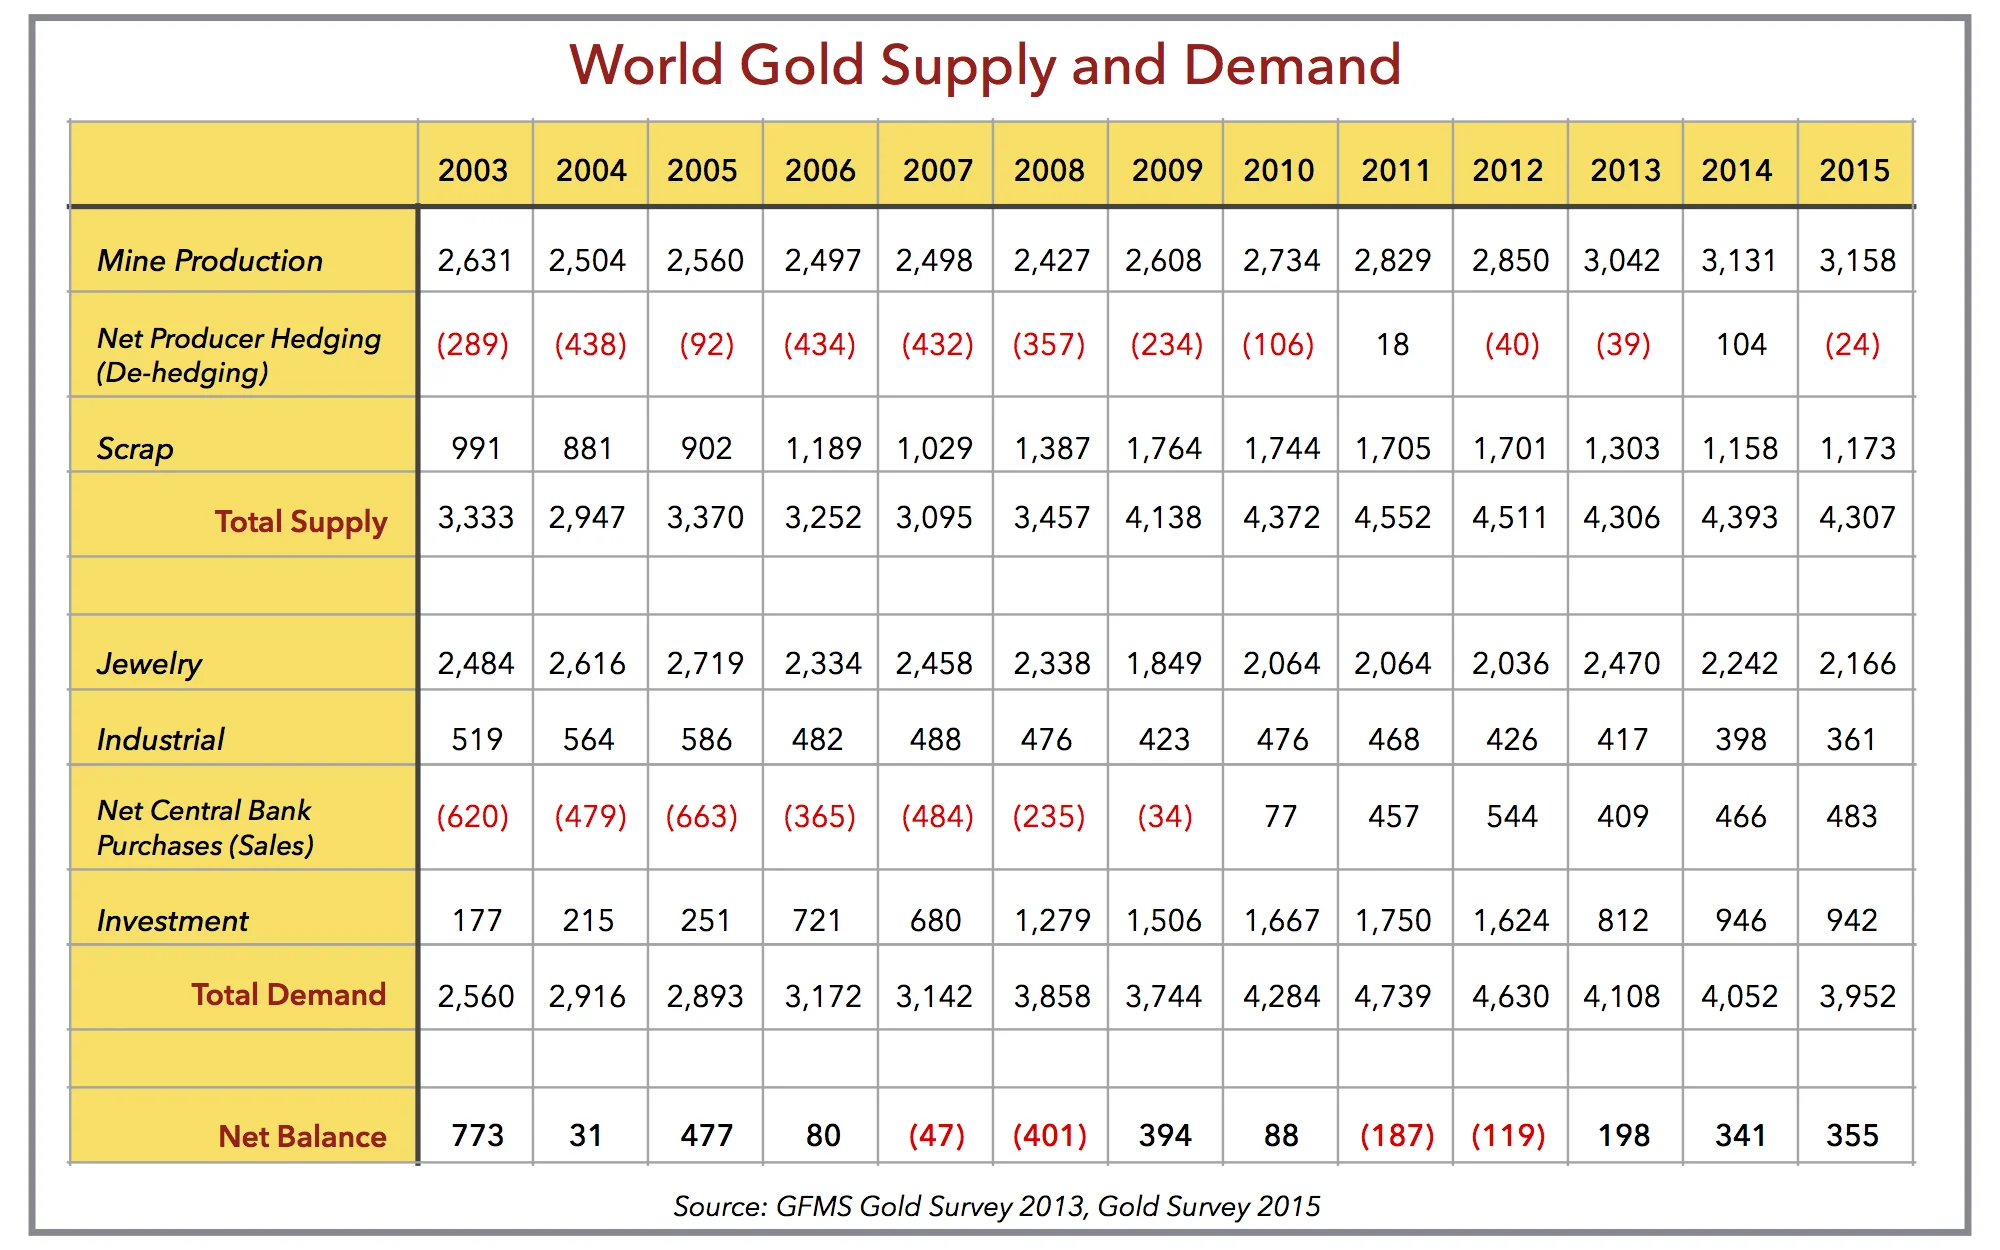
It is important to note that only 31% of gold demand over the last 7 years is from investment, which includes purchases of bars, coins, and ETFs (39% if you include central bank purchases). The majority of gold demand still comes from jewelry and industry (electronics, dental & medical).
Supply Dynamics
Global mine production most likely peaked in 2015 at 3,158 tons. I recently conducted a review of the production guidance for the 15 largest, publicly traded gold miners ("gold majors"). Using the mid-range of their stated production guidance, revealed an expected 6% decline in production. These majors accounted for 35% of all the gold produced in 2015. Three of the very largest—Barrick Gold, Goldcorp, and Newmont—all have guided production significantly lower as the industry is now emphasizing cost efficiency and free cash flow over production growth.
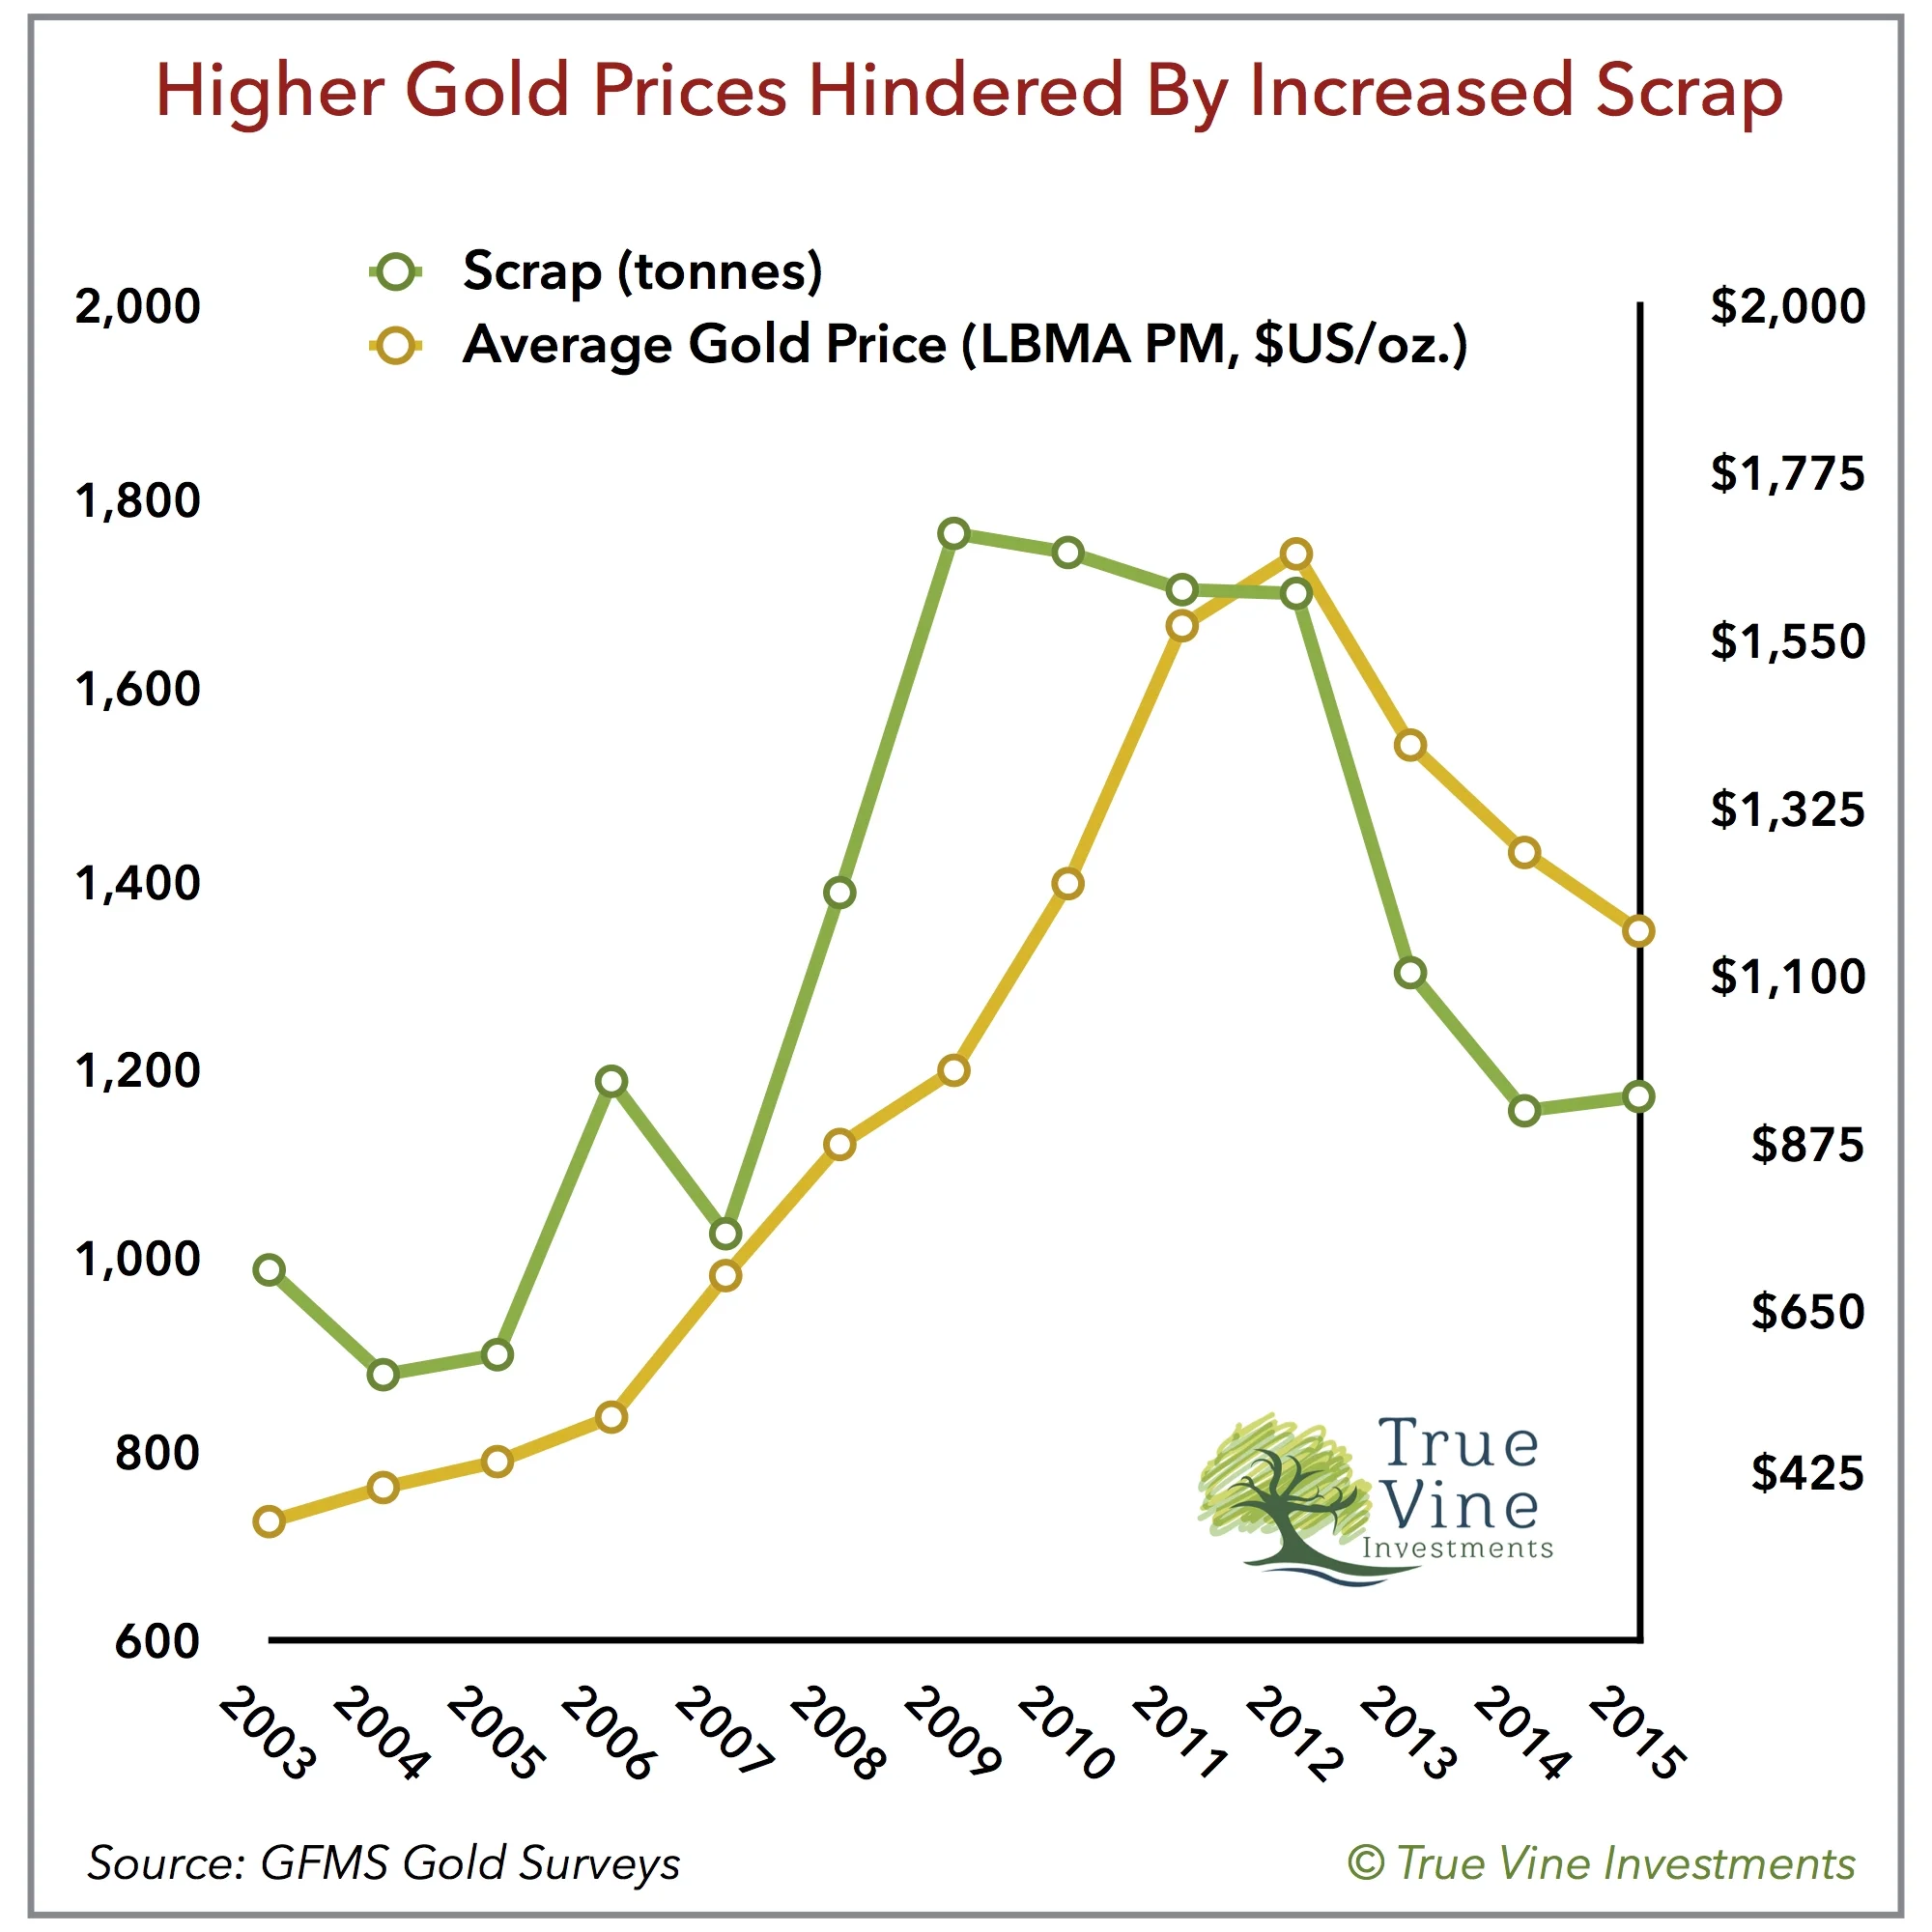
Scrap supply has been highly correlated with gold prices. This chart shows how scrap supply rose and fell alongside gold prices over the last 13 years. Increased scrap supplies have acted as a brake on higher prices.
During the first half of 2016, scrap supply was up 9% year-over-year (y-o-y). For 2016, it is looking like an increase in scrap supply will outweigh mine cutbacks leading to a y-o-y increase in gold supply.
Demand Dynamics
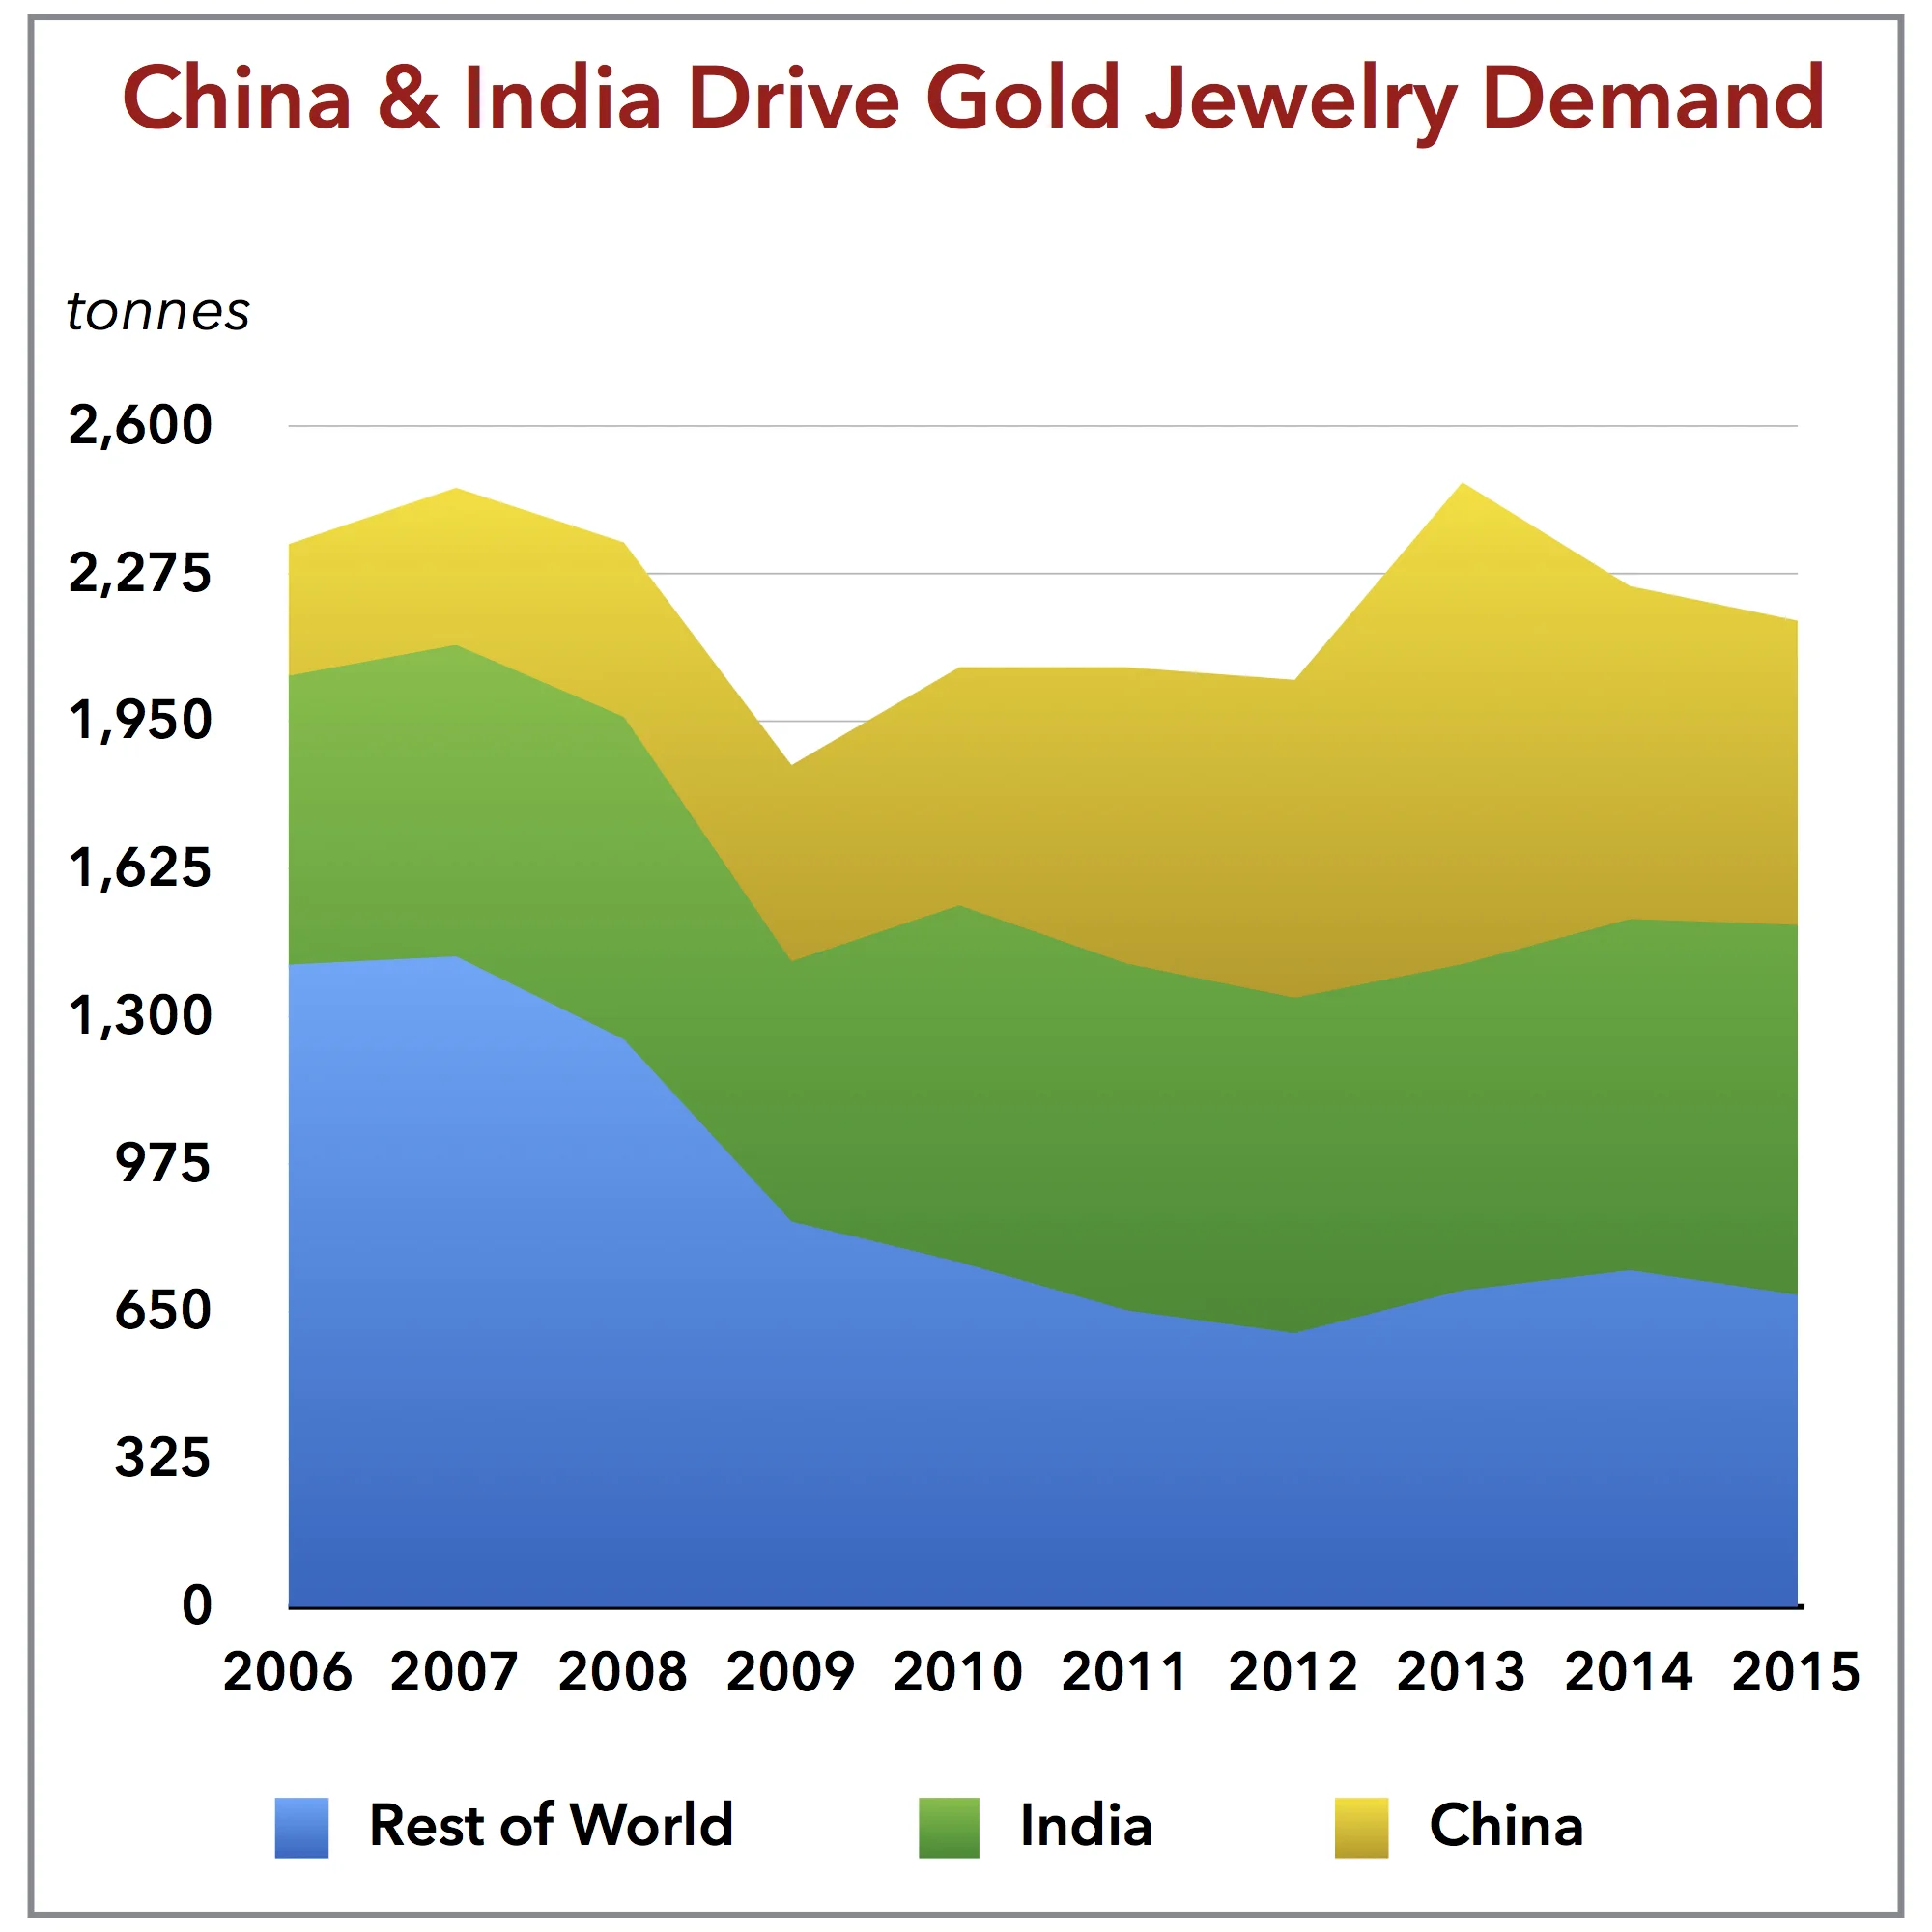
More than 2/3 of global jewelry demand now comes from China and India, as shown on the chart. Despite increasing consumption from China and India, global jewelry demand has not increased over the last ten years. Jewelry demand from the rest of the world has not recovered since the global financial crisis. Higher gold prices and economic malaise have hindered overall demand. Only the increased buying from the now more prosperous Chinese and Indians has held up demand.
During the 1st half of 2016, world jewelry consumption declined 29% y-o-y. Chinese jewelry consumption declined 26%, and Indian jewelry consumption declined 56%! Put simply, jewelry demand is plummeting and this will likely be a significant source of increased supply in 2016.
According to CPM Group, 87.2% of central bank gold buying from 2008 to 2014 was from the following 7 nations:
- Russia - 32.2%
- China - 25.1 %
- India - 8.5%
- Saudi Arabia - 7.6%
- Kazakhstan - 5.2%
- Mexico - 5%
- Iraq - 3.6%
Despite the downturn in the oil sector, Russia has continued to add gold to its foreign exchange reserves at a rapid pace. 48% of central bank purchases in the 2nd half of 2015 were from Russia. However, outside of Russia, lower oil prices may be impacting central bank purchases, because during the 1st half of 2016, central bank purchases declined by 48% y-o-y.
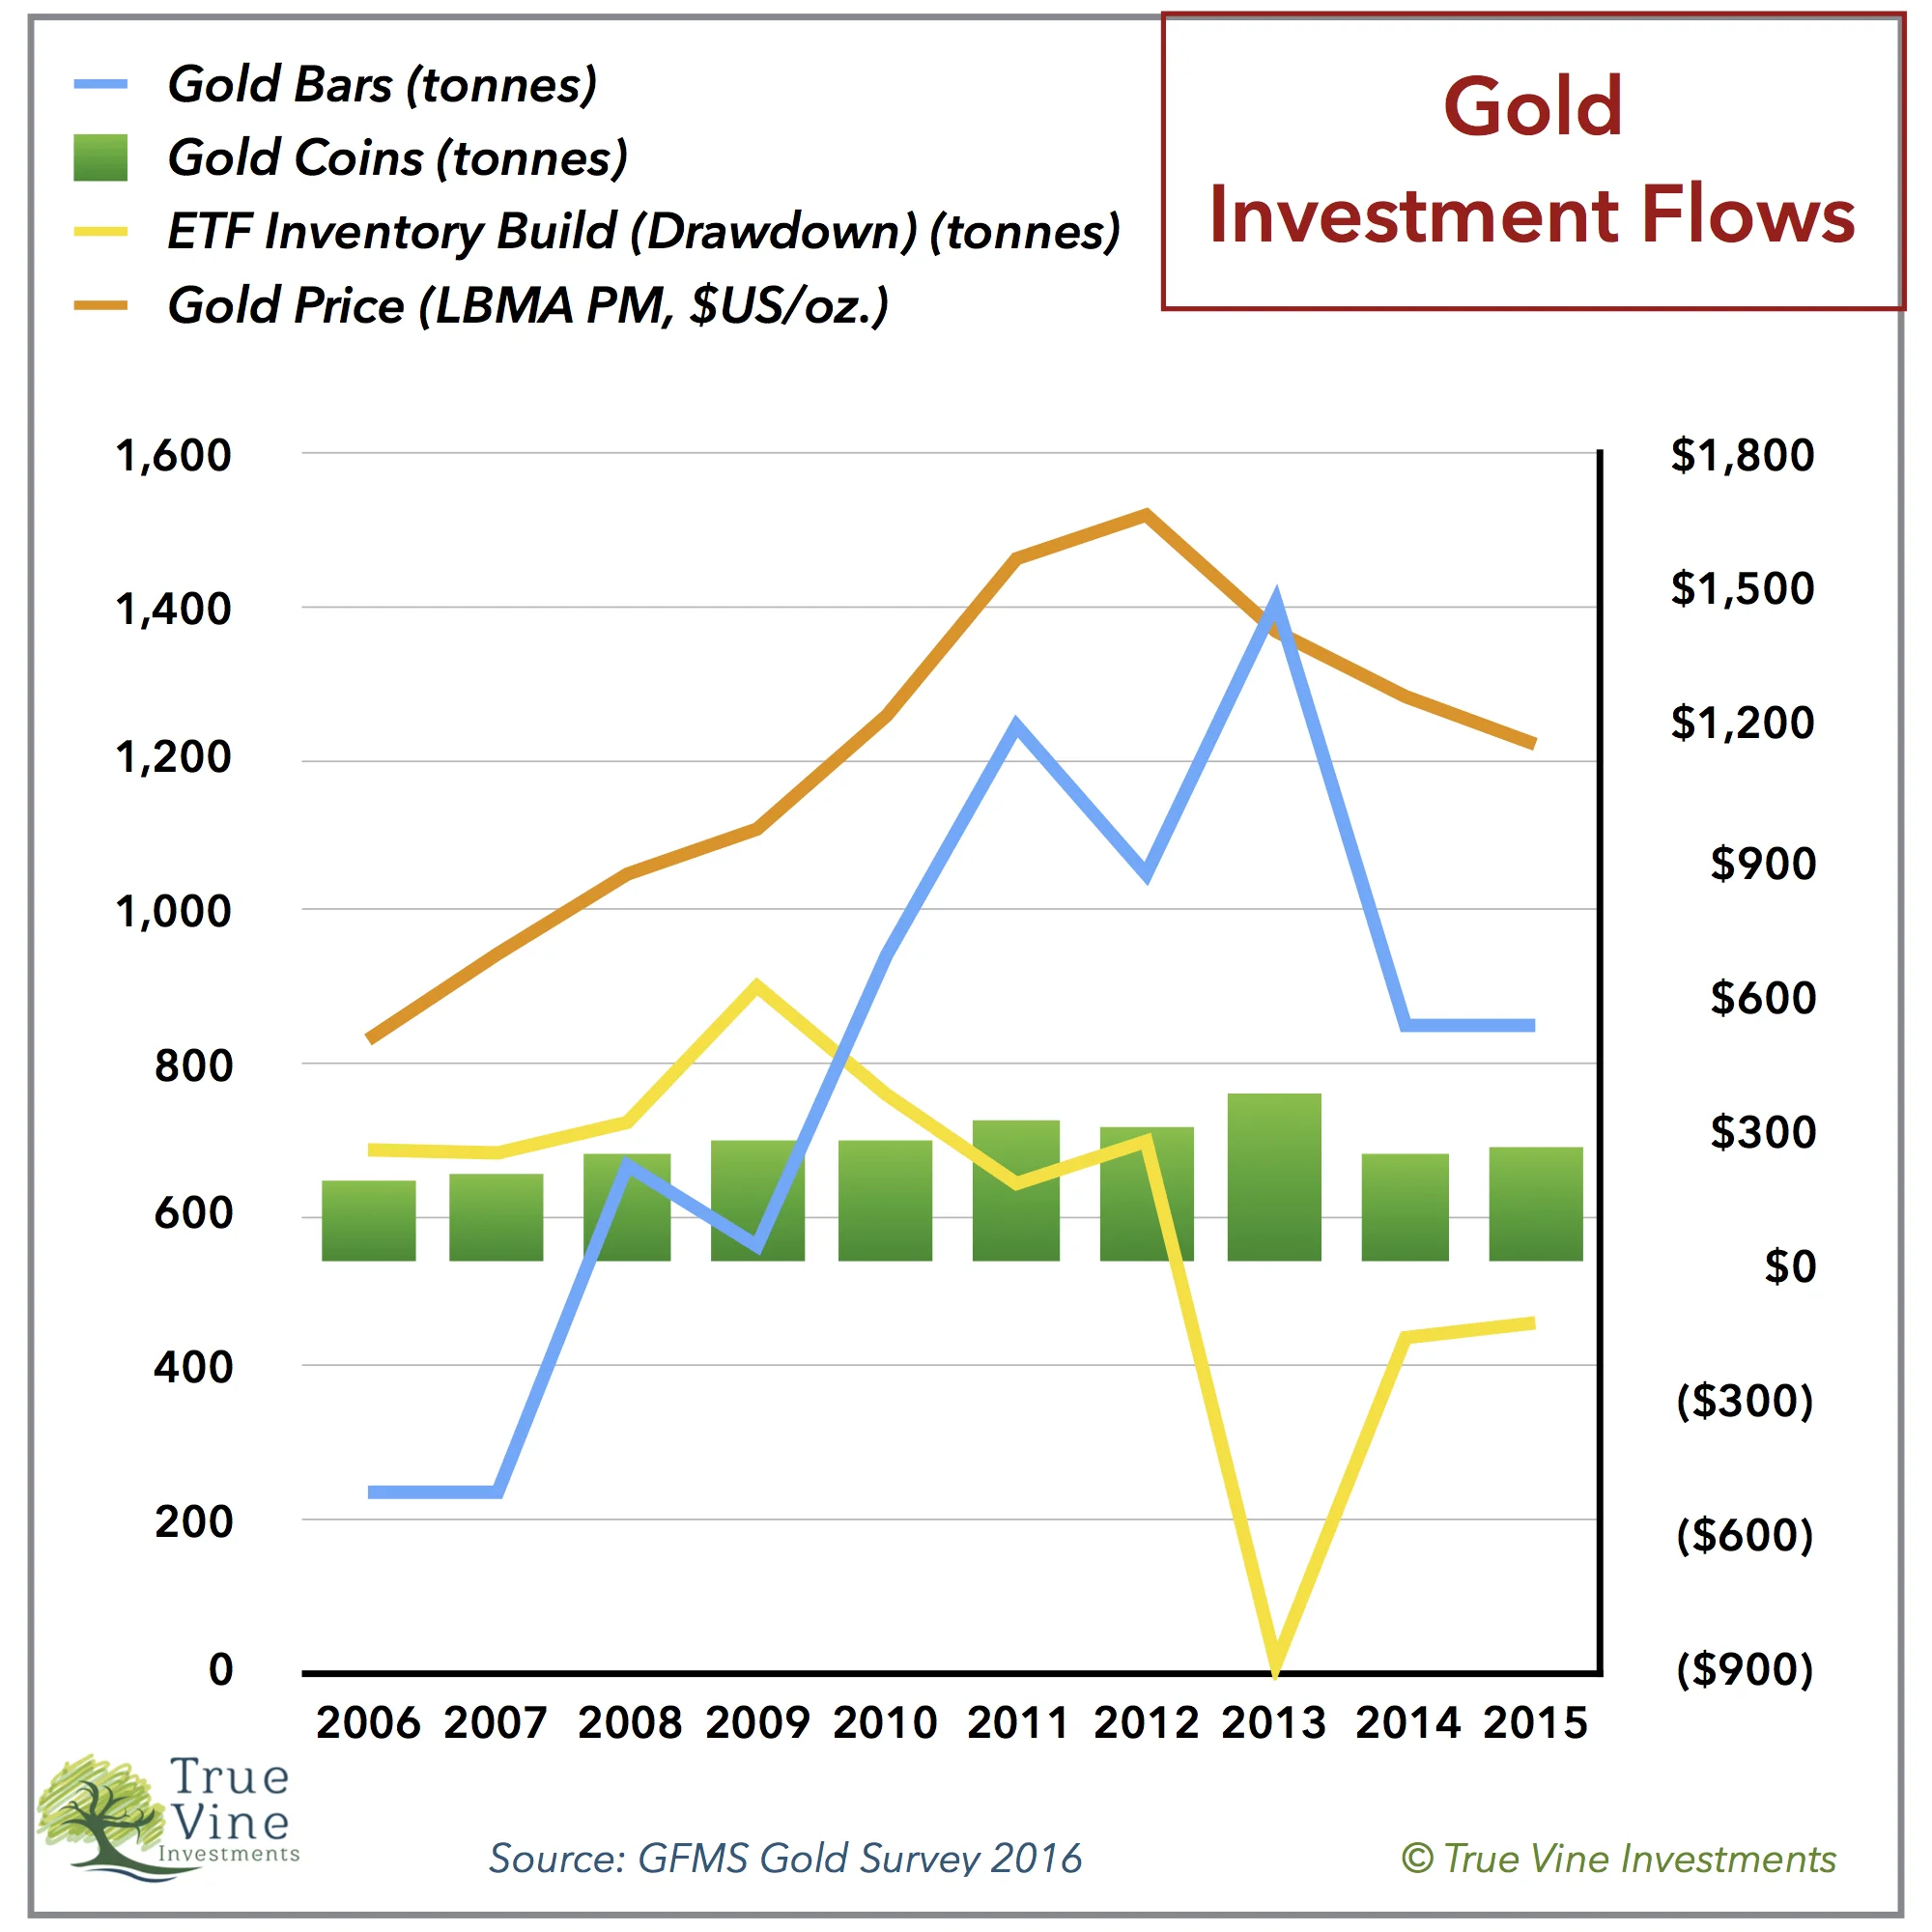
Gold coin demand has been relatively resilient over the last 10 years (see chart above), whereas ETF inventory flows and gold bar demand have swung wildly in response to price action and investor sentiment. If not for the consistency of central bank gold purchases compensating for the declining role of jewelry in gold demand, the gold price environment would be more volatile. This is an important reference point to keep in mind. If the global economy experiences a severe, prolonged downturn, coupled with monetary instability and a lack of confidence in central banks, then jewelry demand would likely be increasingly supplanted by investment demand leading to an environment of increased price volatility.
ETF inventory demand soared during the 1st half of 2016, increasing by 568 tons, whereas demand for gold bars fell by 11% y-o-y.
Gold Price Forecast
I have made it a point in this report to reference the rapidly declining, y-o-y fundamentals for gold demand drivers. The fact that the only positive demand driver is ETF buying points towards short covering, hot money investor flows, and a temporary price reversal (higher).
“The fact that the only positive demand driver is ETF buying point towards short covering, hot money investor flows, and a temporary price reversal (higher).”
My macroeconomic expectations for the next two years includes a higher U.S. dollar, ongoing deflationary environment, and a global economic recession with Japan, continental Europe, and China being at the forefront (in that order). This outlook underpins aspects of my gold price forecast.
The key factors impacting the supply and demand fundamentals for gold over the next few years can be summarized as follows:
- Mine production peaked in 2015 and will decline by 2% to 4% annually from 2016 to 2019.
- Scrap supply will stay strong, supported by higher gold prices in non-U.S. dollar based economies as their local currencies depreciate against the U.S. dollar.
- Jewelry demand declines, impacted by a global recession.
- Central bank purchases fall in 2016 and then resume a gradual increase as central banks in developing economies increasingly seek reserve diversification. Higher oil prices support increased purchases from the likes of Russia, Kazakhstan, Saudi Arabia, Mexico, and Iraq.
- A higher U.S. dollar weighs on gold sentiment and continues to depress investment in ETF inventory and gold bars, before the market turns in 2018-19 alongside of a cohesive effort by central banks and fiscal authorities to reflate the global economy.
The following chart reveals my average annual price targets for gold over the next few years as weighed against the supply and demand fundamentals:
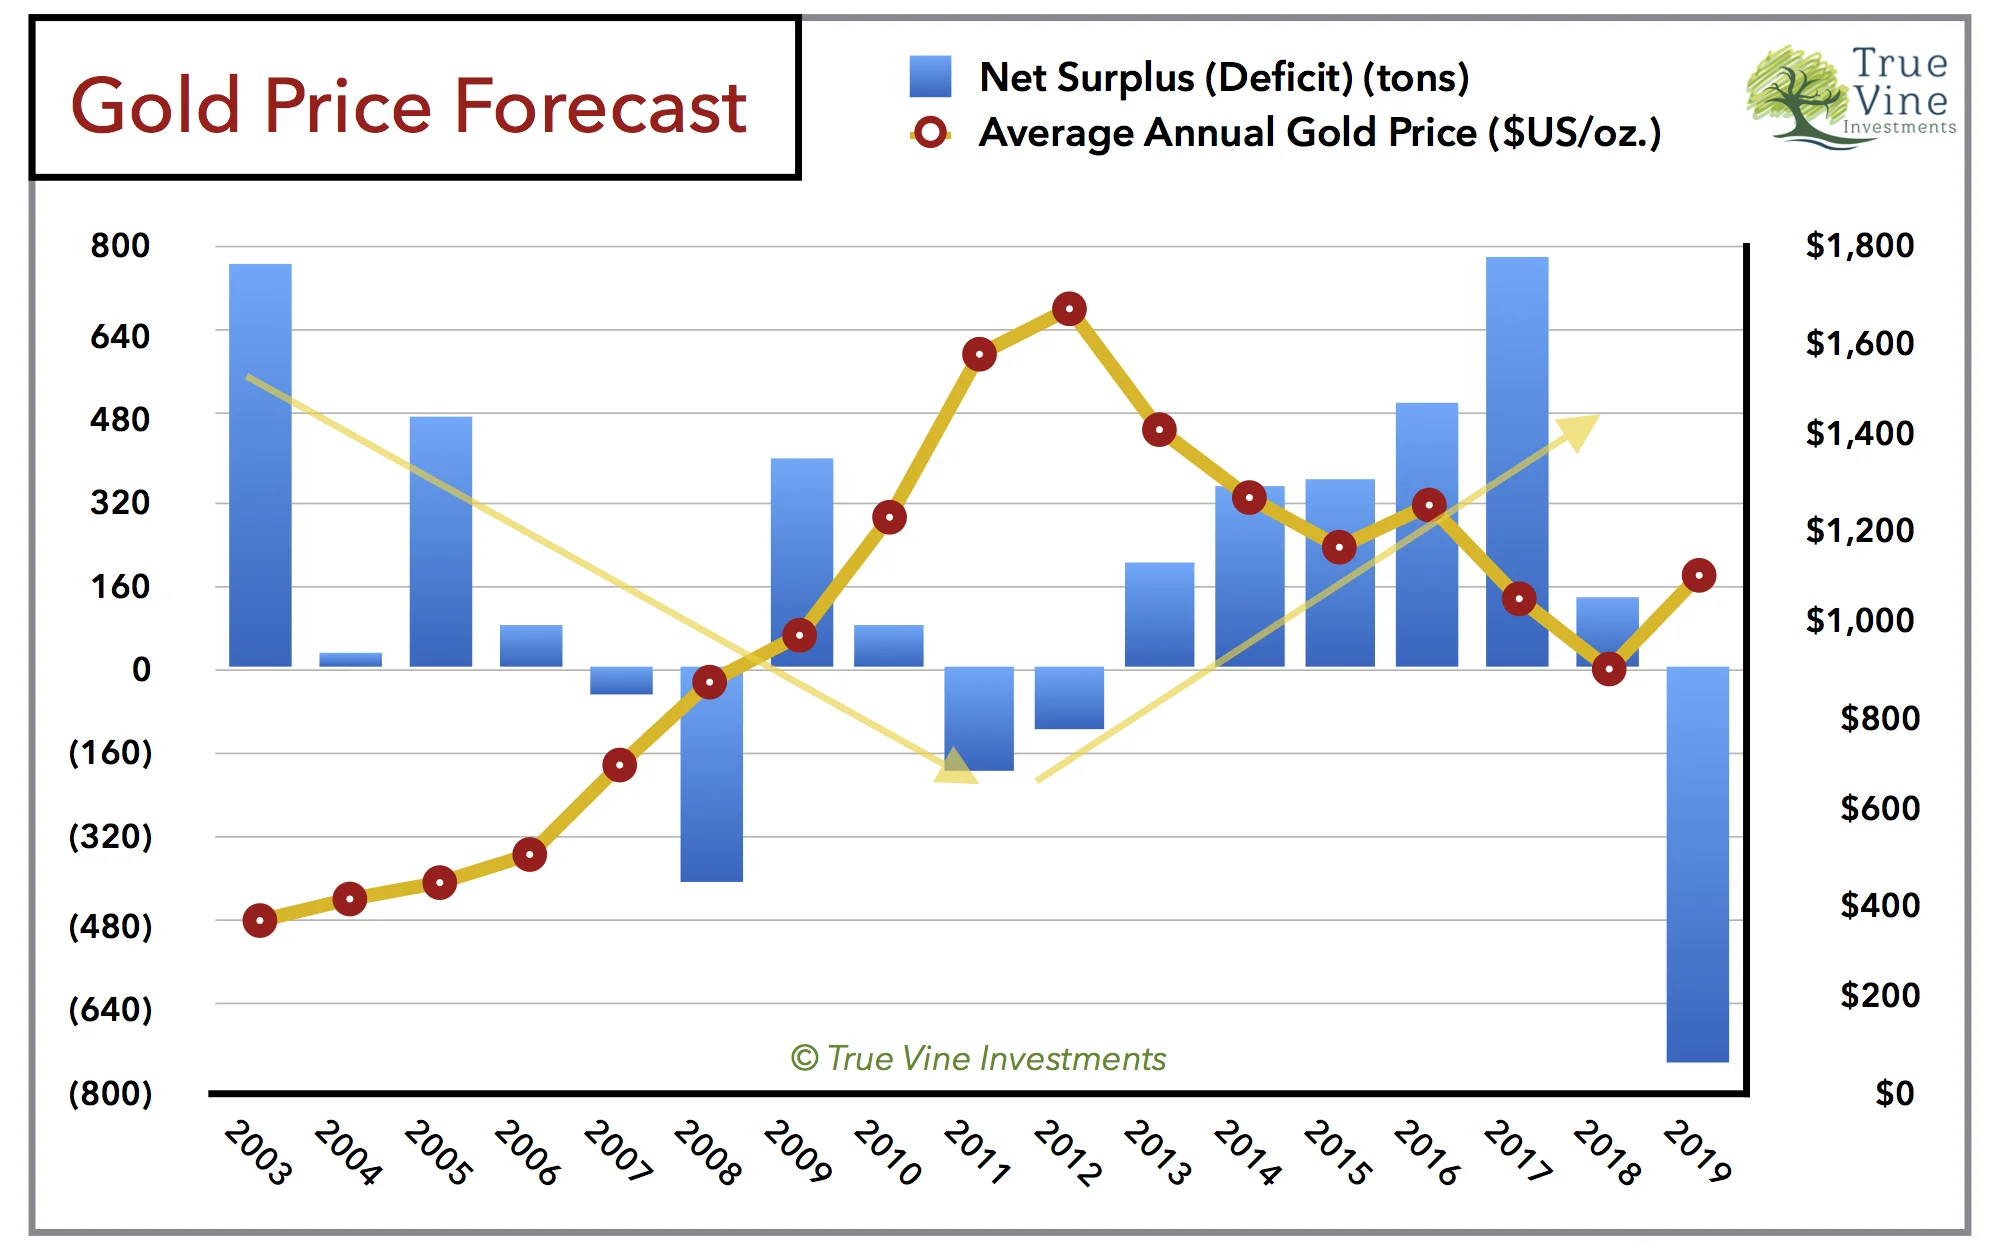
Note in this chart the yellow arrows that I have included to highlight the longer term structural supply & demand trends impacting the price of gold. From 2003 to 2011, the trend was towards increasing supply deficits. From 2012 to 2018, the trend has been and will continue to be a toward increasing supply surpluses. I am forecasting that gold will bottom around 2018, after which this trend will break and a longer term trend toward supply deficits will resume.
I think the key data point to watch will be purchases of gold bars as these represent the sentiment of deep-pocket, longer term investors who want to safeguard their wealth with physical product. As gold prices continued declining in 2015, purchases of gold bars did not spike like they previously did in 2013. They were exactly the same as in 2014 at 851 tons. As previously mentioned, demand for gold bars continues to fall in 2016.
Strategic Conclusion
The market is overlooking the supply and demand fundamentals for gold and focused on negative interest rates (although they are not negative in the U.S. and China) and so-called “helicopter drops” where central banks coordinate policy with fiscal authorities to stimulate economic growth and stave off deflation. I see this as an eventuality, but it will not be positive for gold until the U.S. takes such an action, reversing the trend of a higher U.S. dollar. At present, such a move is unlikely outside of a recession and associated financial crisis, which economic fundamentals would suggest is still at least a year away. There has been a lot of hype over gold this year, but rarely does one read or hear about the plummeting demand from jewelry buyers and central banks. This monetary idol still has room to fall.
Joshua S. Hall, ChFC
Disclaimer:
The True Vine Letter is a publication of True Vine Investments, the investment advisory business of Joshua S. Hall, ChFC, a Registered Investment Adviser in the U.S.A. The information presented in The True Vine Letter is provided for educational purposes only and not to be used or considered as an offer or a solicitation to sell or an offer or solicitation to buy or subscribe for securities, investment products or other financial instruments, nor to constitute any advice or recommendation with respect to such securities, investment products or other financial instruments. The True Vine Letter is prepared for general circulation. It does not have regard to the specific investment objectives, financial situation, and the particular needs of any specific person who may read this letter. You should independently evaluate specific investments and consult a professional before making any investment decisions.
All data presented by the author is regarded as factual, however, its accuracy is not guaranteed. Investors are encouraged to conduct their own comprehensive analysis.
Positive comments made regarding this article should not be construed by readers to be an endorsement of Joshua S. Hall's ability to act as an investment adviser.